The Real Cost of Living 2025-06-24
The rising cost of living is a growing subject of concern in many nations, it seems like prices are always rising over time and life is becoming less affordable. Most people would agree the cost of living seems to be rising, as evidence we can point out the Consumer Price Index (CPI) is constantly rising over time. However, in order to know how the cost of living is really changing we need to take into consideration how wages are also changing. This will allow us to get a more accurate idea of how the cost of living has actually changed over time.
Wages are also rising over time, and if they rise fast enough it can completely counteract inflation. Most people will also argue wages aren't rising fast enough, and I would agree, but let's look at the data to see what is actually happening. In order to do this we need a good way of measuring price inflation, and I don't think the CPI is the most reliable way of tracking price inflation. That is why I decided to try my hand at creating my own metric to measure inflation, something I call the "Cost of Living Index" or COLI, using publicly available data provided by the Federal Reserve Bank of St. Louis.
Using COLI I can double check my results against those produced when using the CPI to ensure the results are consistent and to get a better of idea of how consumer prices have really changed. COLI is based on the price of 7 items: Food, Energy, Houses, Rent, Metal, Rubber/Plastic, and Lumber/Wood. The weights of each item are roughly based on how much they impact the cost of living, you can fiddle with the weights and it wont change the final result very much, which tells me I'm on the right track.
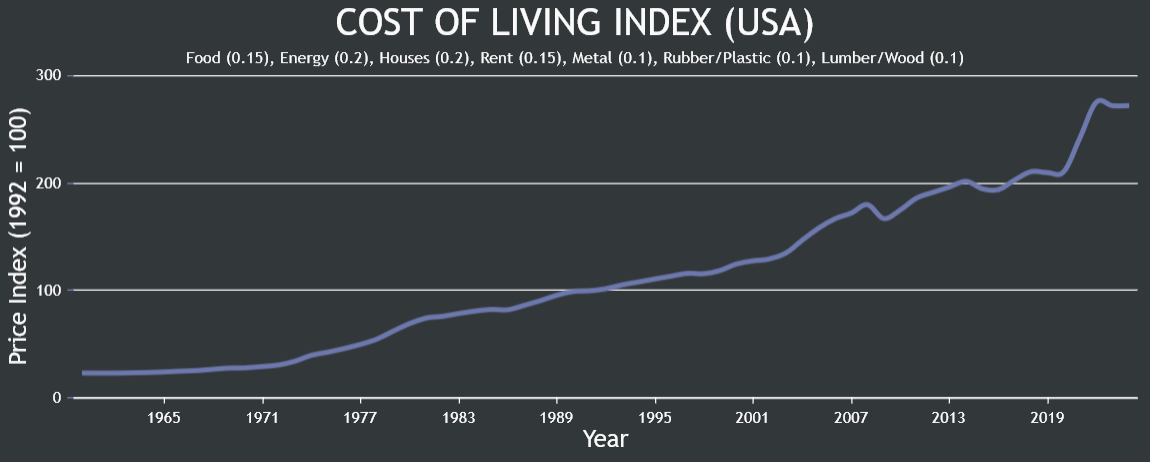
This shows us that prices have more than doubled since 1992. Now let's compare that to the traditional CPI:
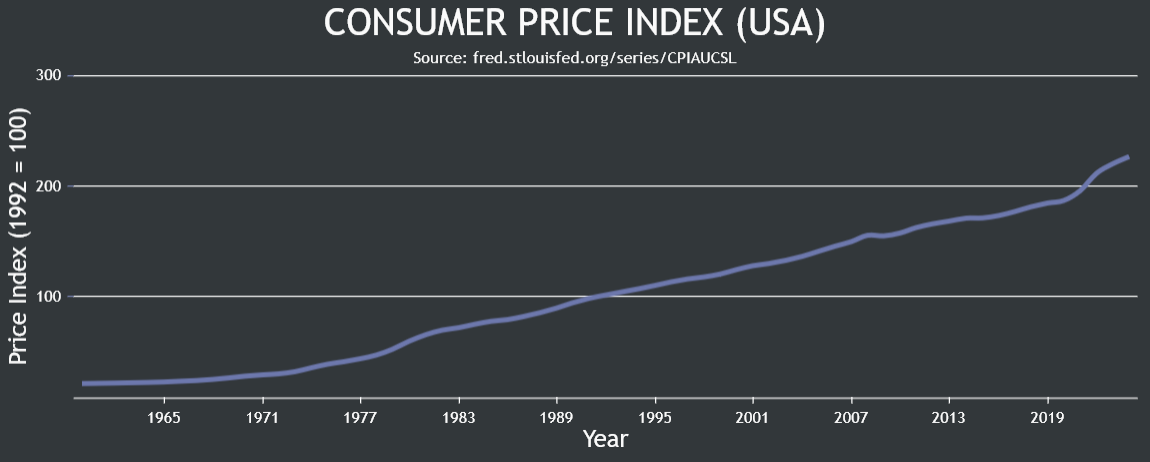
As we can see, the CPI and COLI both start around the same place and end around the same place, but I think COLI does a better job of capturing the massive price spikes which occurred during and after 2020. That's another good sign that COLI is a good measure of inflation. In order to calculate how the cost of living has really changed, now we need to take into account wage growth. If wages rise faster than prices, the real cost of living will fall. If wages don't rise fast enough, the real cost of living will increase. However, wages ignore things like taxes, so what we really want to know is the average Disposable Personal Income.
Disposable Personal Income refers to the income an individual has left after paying taxes and other mandatory expenses. We just need to convert the dataset so it's in a per capita format (aka average income of each person). The result should be something I call the "Real Cost of Living Index" because it takes into account both prices and wages to tell us how the cost of living has really changed over time. I don't think I've seen this done before, but it's such an obvious idea I'm sure it has been done before. You will probably find the result quite surprising, I know I did.
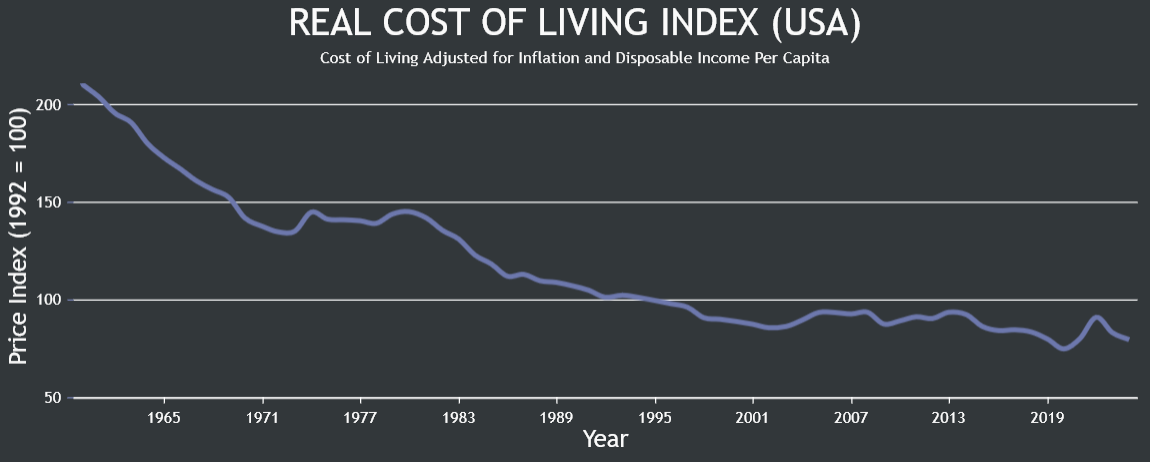
This chart tells us the real cost of living actually seems to be falling over time. I was expecting to see the real cost of living slowly rise over time or stay about the same, but I certainly wasn't expecting this result. At first I thought maybe there was something wrong with COLI, so I tried doing the same thing using the CPI to measure inflation, but I got basically the same result, in fact it showed an even steeper decline in the real cost of living because the CPI has less price inflation than COLI. It does "feel" to me like the real cost of living is rising, I highly doubt it is falling.
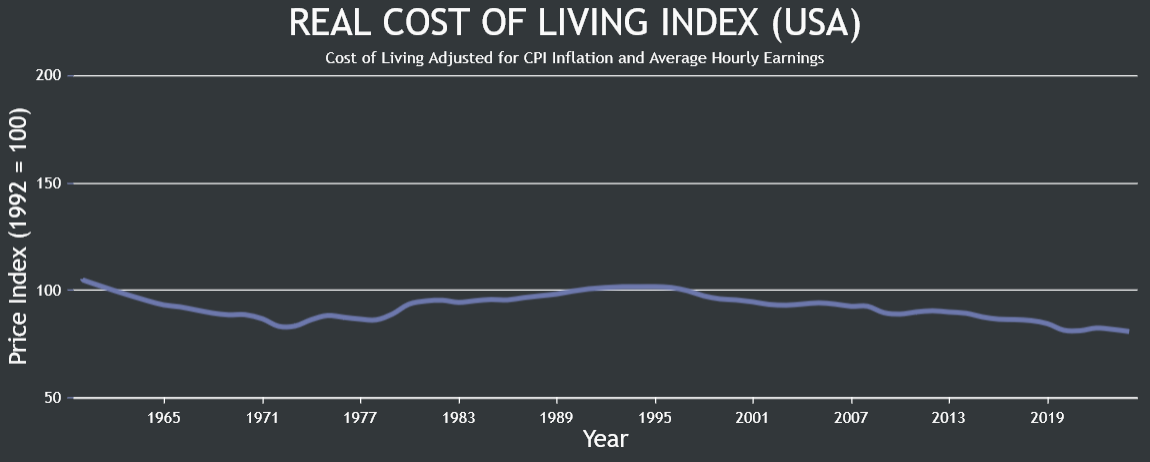
That made me think that using Disposable Personal Income might not be the best method, even though I can't think of any good reason why it shouldn't work. So I decided to try using Average Hourly Earnings data and what do you know, it seems to work. We see a trend which is stable over long periods of time, indicating that the use of average hourly rates may be a better way of determining the real cost of living. The line may look quite flat, but that rise starting in 2020 equates to a 17% rise in the real cost of living.
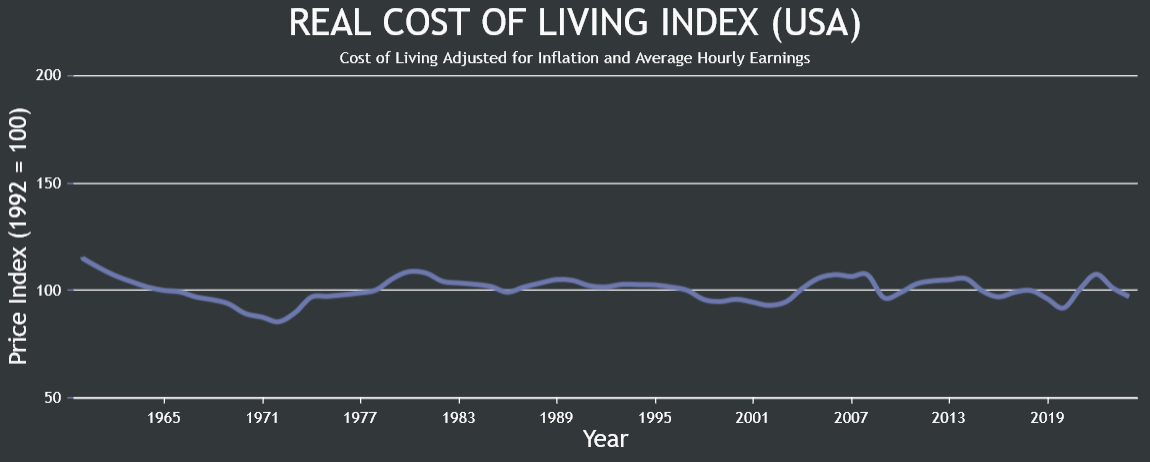
This chart tells us that if you work the same number of hours as a person in the 60's, then your real cost of living is essentially the same as that person in the 60's. It appears as if the hourly rate does increase enough to balance out the rise in prices, at least over long periods of time. I have some ideas about why the real cost of living doesn't seem to be rising over time which I will discuss in a moment, but first let's double check the result we just got. Here's what it looks like when I use the CPI instead of COLI, while still using average hourly earnings:
If we believe that the CPI is an accurate measure of inflation, then this chart tells us the cost of living has been consistently falling since the 90's. I think most of us can agree that isn't reality, meaning the CPI is underestimating the amount of inflation occurring over time. It barely even shows any rise in the cost of living around 2020, so the CPI seems to be a fairly poor way to measure inflation. Even when using COLI we don't seem to see any rise in the real cost of living over long periods of time, which actually makes sense when you think about it.
If the cost of living were to constantly rise we would eventually all be living in extreme poverty, but poverty rates seem to be improving over time, especially on a global scale. Wages must rise in order to balance out the rise in prices over time, and that's what we see, but I was not expecting to see the cost of living fall over time when we use disposable personal income. After thinking about it for a while, I think the reason is probably related to the fact that after World War II ended, tax rates started to drop substantially, leaving people with more disposable income.
When people have more disposable income but the price of consumer goods stays the same, then it means the real cost of living has fallen, allowing people to buy more stuff. It's often argued that life in the 50's seemed great despite taxes being so high, when in reality those high taxes may have been the primary thing which made their real cost of living unusually high. If you fell into the highest tax bracket you might have paid over 90% in income taxes, but keep in mind that rich people have many ways to avoid paying taxes, so it's unlikely they really paid that much in taxes.
Nations on the winning side of a war often experience an economic boom, combine that with rapidly falling tax rates, and it's not hard to see why life probably felt pretty good at the time, despite the high cost of war. The USA had record low tax rates before the war occurred and one could argue their cost of living was the same or even better. Furthermore, it's fairly easy to show that higher taxes aren't the simple answer to all our problems, because if that were the case, the nations with the highest tax rates should have the lowest cost of living, yet we usually see the opposite trend in real data.
Having said all that, it still "feels" to me like the real cost of living is rising, and there must be a reason for that. At first I thought maybe people are spending more money than they earn, meaning they have more debt. In that case, using income data or hourly rates might not tell us the whole story because it doesn't tell us how much money people are really spending. Our modern life styles do come with a lot of new expenses that didn't previously exist, so that certainly seems like a plausible theory, but it turns out, that probably isn't the answer.
It appears as though the percentage of household income spent on paying off debt has remained fairly stable going back to the 60's, meaning debt hasn't really had any impact on the real cost of living. Next I thought, maybe it's because people are simply working less hours on average. When I said "if you work the same number of hours as a person in the 60's", it occurred to me the real cost of living would seem to increase if people work less. The data does show people are working less, in the 60's people were working almost 40 hours a week, now people work around 34 hours a week on average.
Using that data I created a new chart for the Real Cost of Living Index... and the result barely changed at all. That is mainly because the average work hours has remained stable at 34 hours per week since around 1990, so it doesn't change anything after 1990. Even before 1990 the average work hours don't change enough to have any considerable impact on the final result. It does make the real cost of living slightly cheaper in the 60's and 70's, but that's really because they are working more and therefore earning more real income, so it's not really a "fair" comparison.
So the decrease in working hours doesn't really help explain why the real cost of living feels like it is rising, especially not any time after 1990. One final thing I decided to try was doing everything all over again, but this time using global data instead of just data from the USA. I created another Cost of Living Index using a group of similar weighted items, but excluding a few items I couldn't find any good data for. Unfortunately, I was only able to find data going back to 1992. I also found a dataset containing the average annual wage in OECD nations going back to 1992.
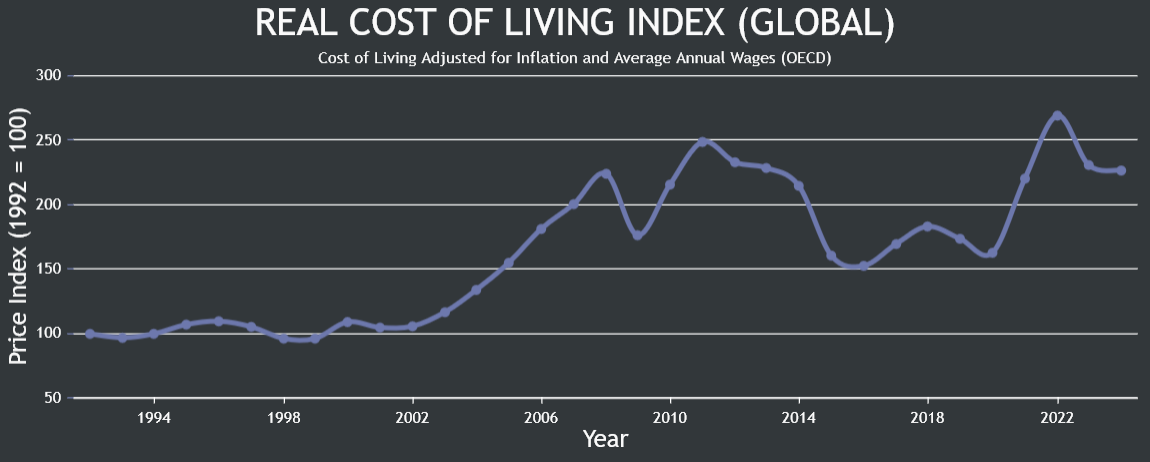
As you see in this chart, it looks like the real cost of living on a global scale has more than doubled since 1992. That is the type of result I was expecting when I started on this journey, and it "feels" about right to me. I don't live in the USA, but I do live in an OECD nation, and it looks like the real cost of living has risen much faster outside the USA, which may explain my feeling. The USA appears to have a much more stable economy than most nations, but that isn't really surprising considering they have the world reserve currency and a much stronger economy than most nations.
Advertisements